
FlareSens Pulse · Reporting & Analytics
Know if you’re actually getting safer — and prove it.
Every event on your panels becomes a report that answers the questions leadership, insurers, and fire officers ask — before they ask them.
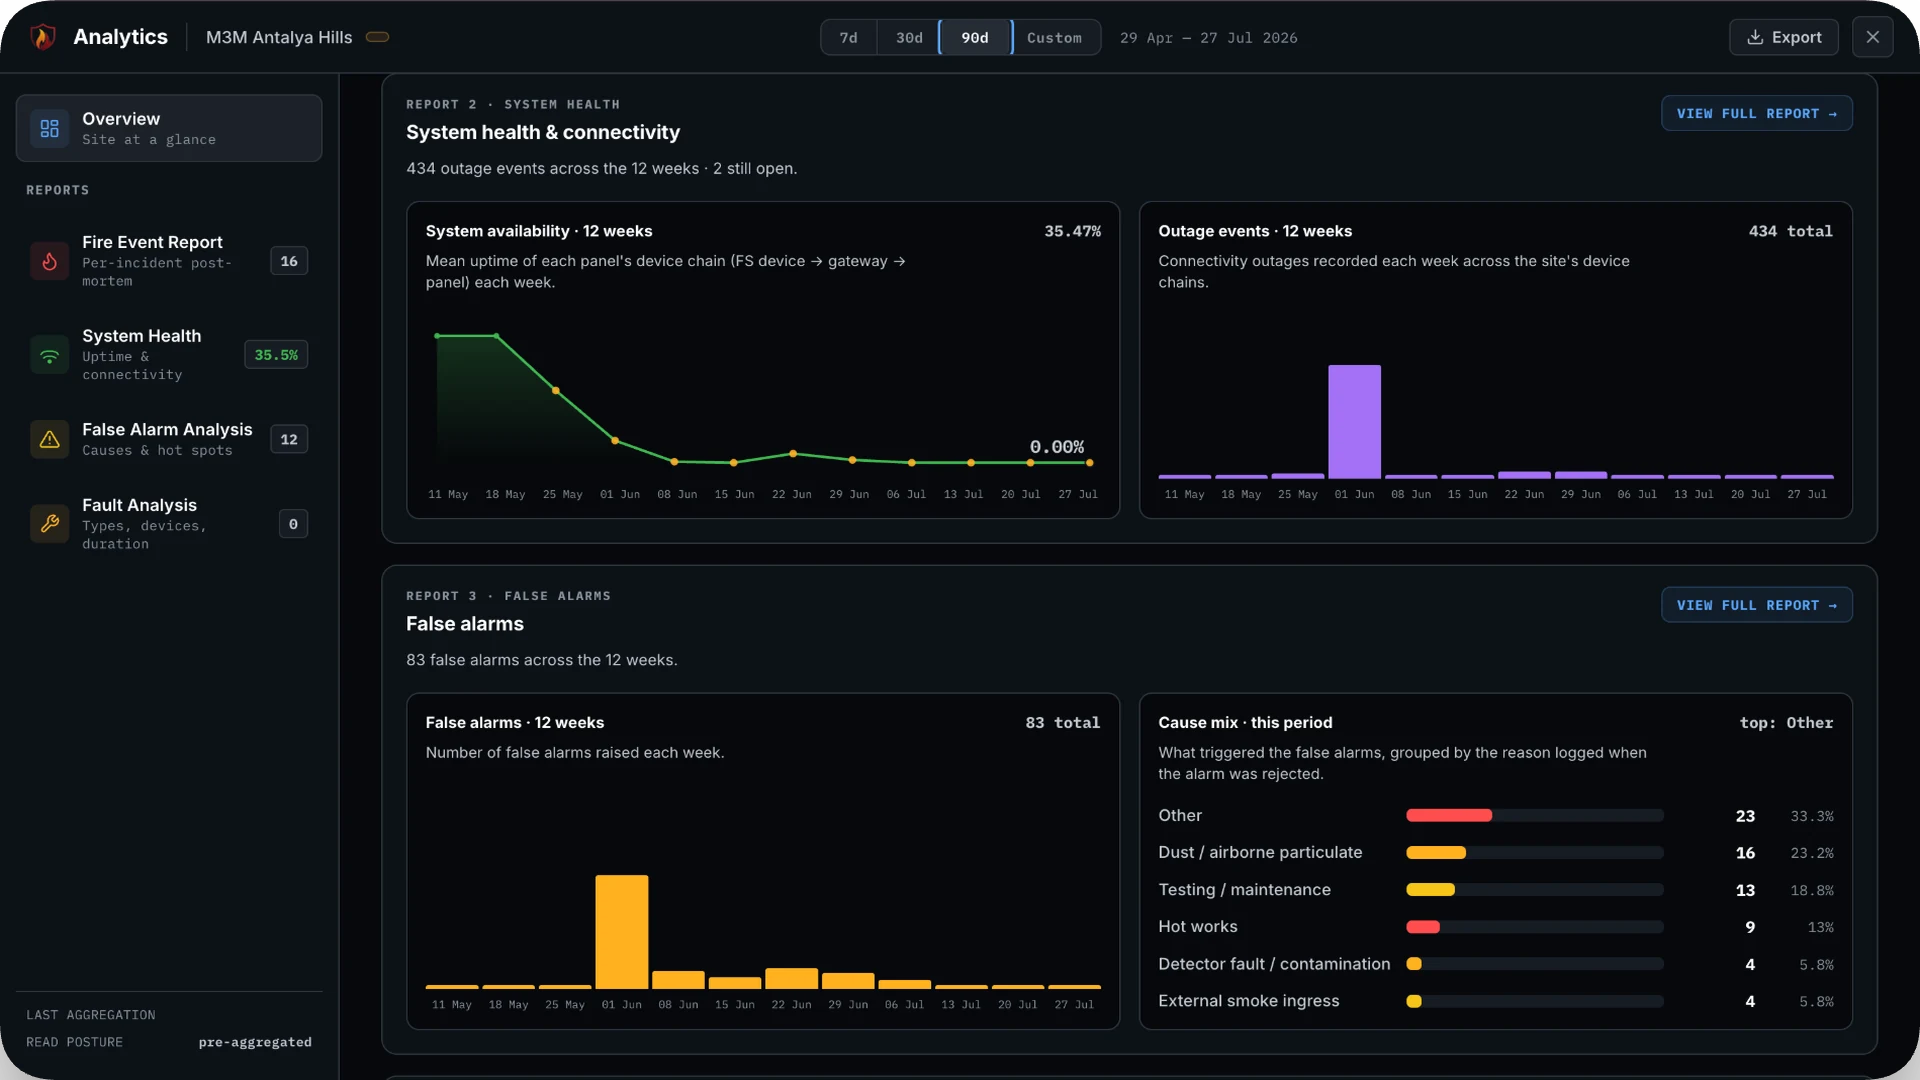
Site Overview
The whole estate, in four numbers that move.
One dashboard, twelve weeks of trend. Each number opens into the full report behind it.
Response speed
How fast alarms actually get acknowledged — measured, not assumed.
Fault resolution
How long problems stay broken before someone clears them.
System availability
How much of the time the system was truly online and watching.
False-alarm rate
How many of your alarms were real — and how many cried wolf.
Four reports
Four questions your building can finally answer.
Was the response fast enough? Was the system even online? Why do the alarms keep crying wolf? What keeps breaking? One report each.
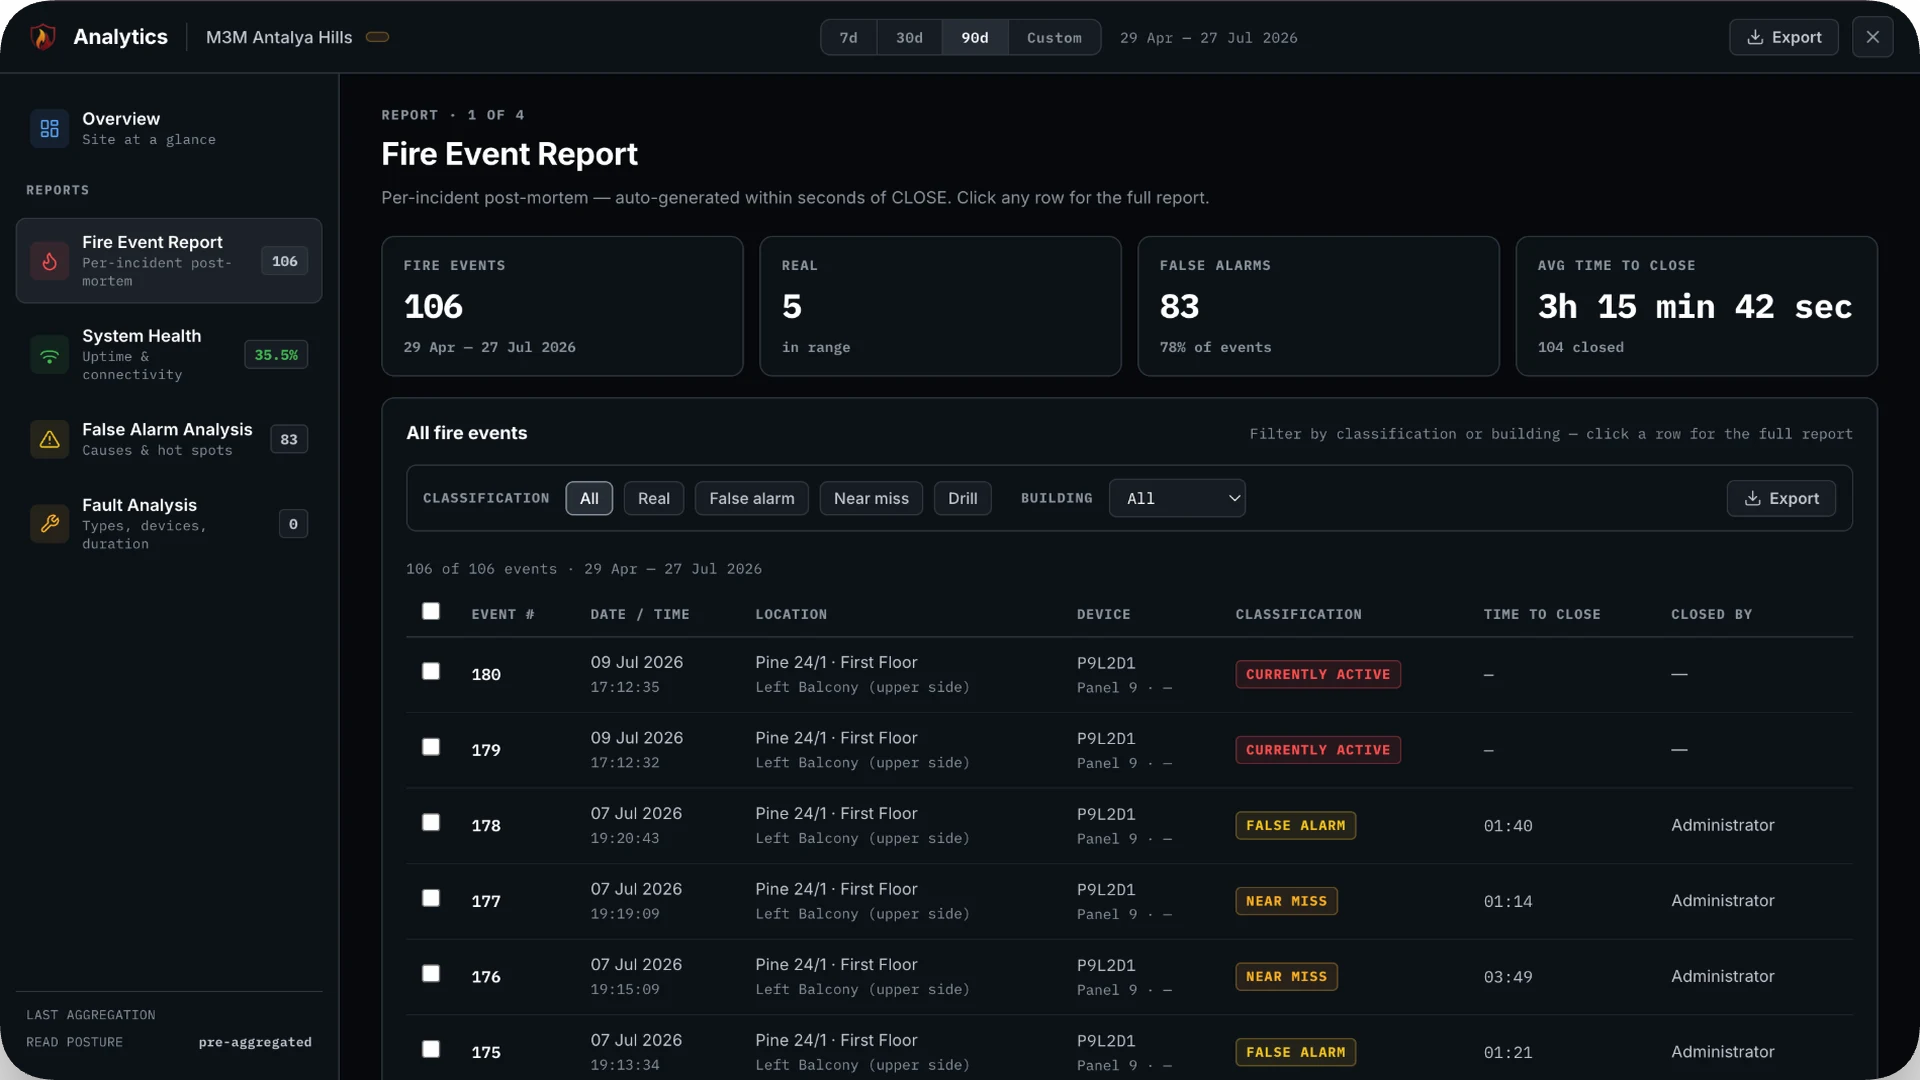
Fire Event Report
Every fire event, rebuilt to the second.
One report per incident — the whole story an insurer or fire officer will ask for, already assembled.
- The point of origin pinned on the building floor plan
- A timestamped timeline of every trigger, acknowledgement, and message
- Response times scored against target — detection, notification, first responder
- Classification and root cause, ready to hand over
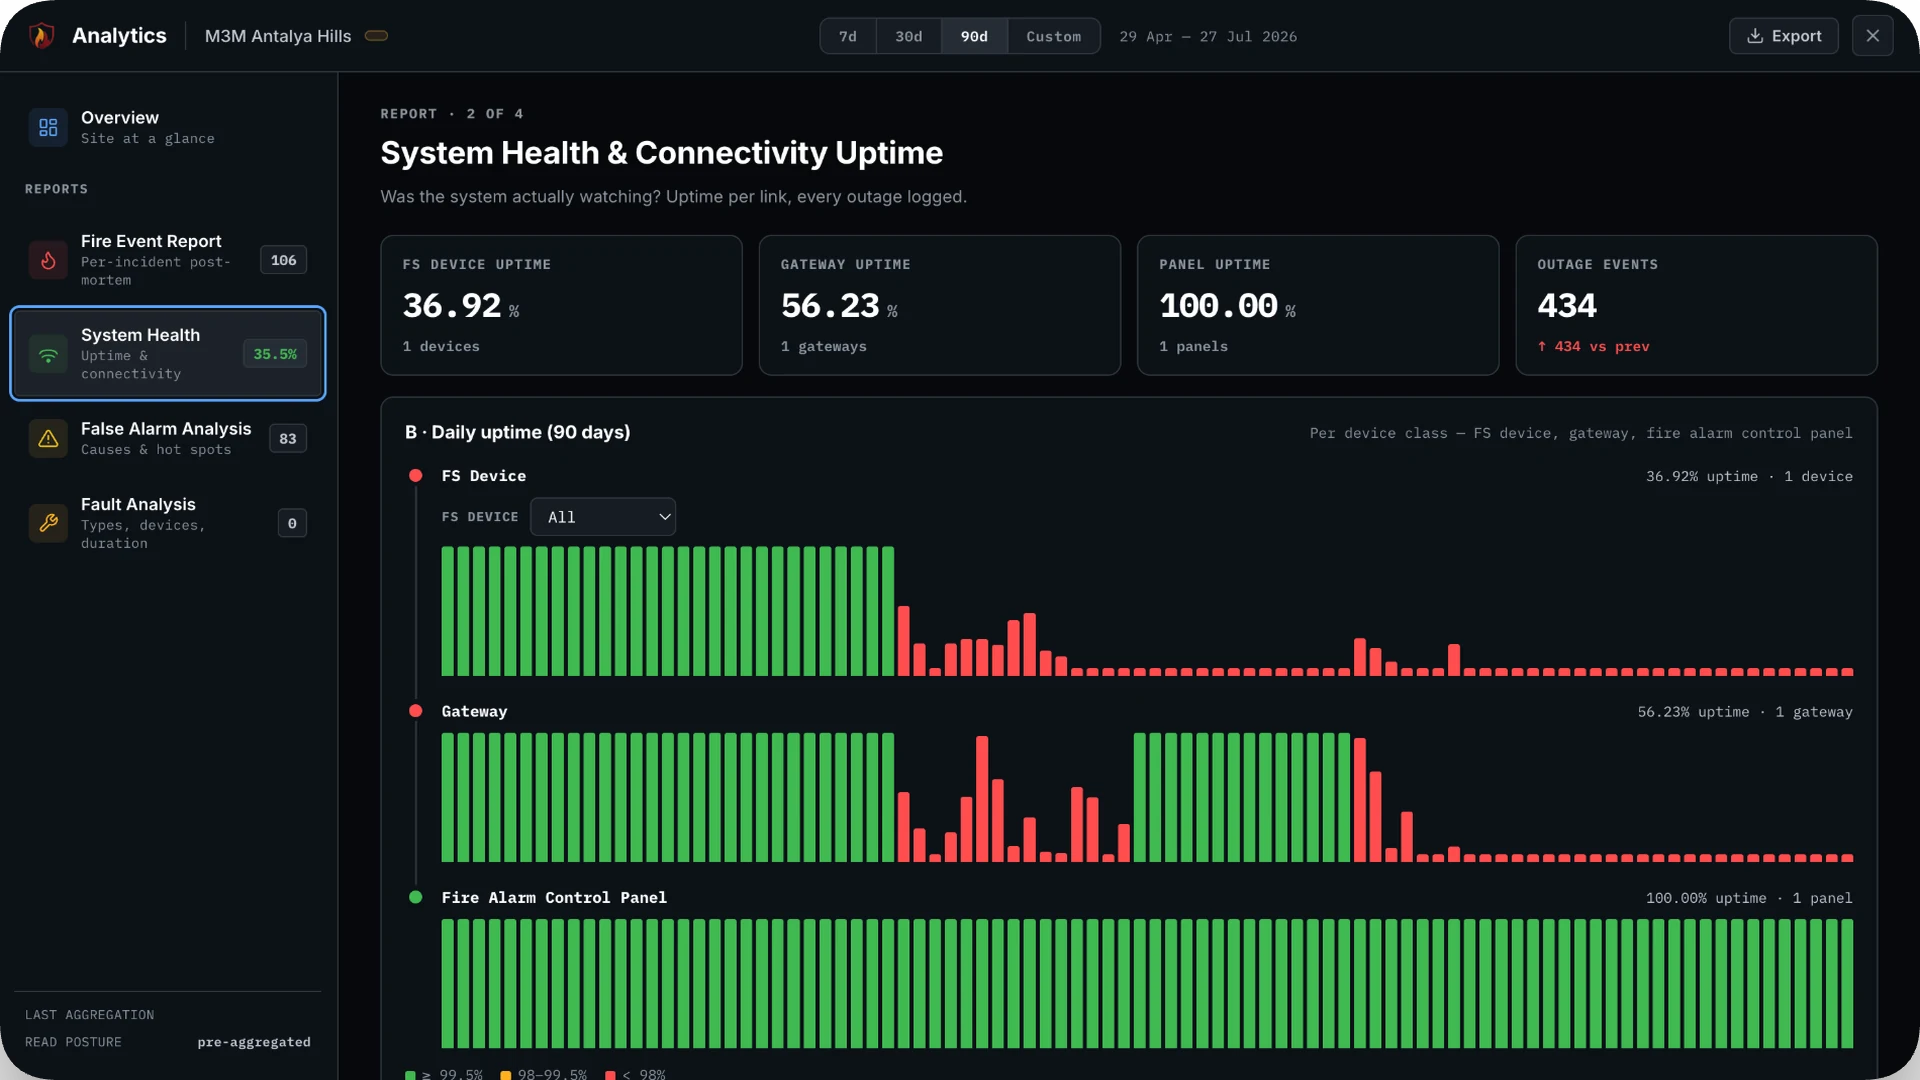
System Health
Was the system even watching?
The one report no one else can give you: proof the whole chain — FS device, gateway, panel — was actually online.
- Uptime for every device, gateway, and panel over 30 days
- The full chain scored per panel, worst first
- Every disconnect logged — when it dropped, when it came back
- The honest answer to “were we actually covered?”
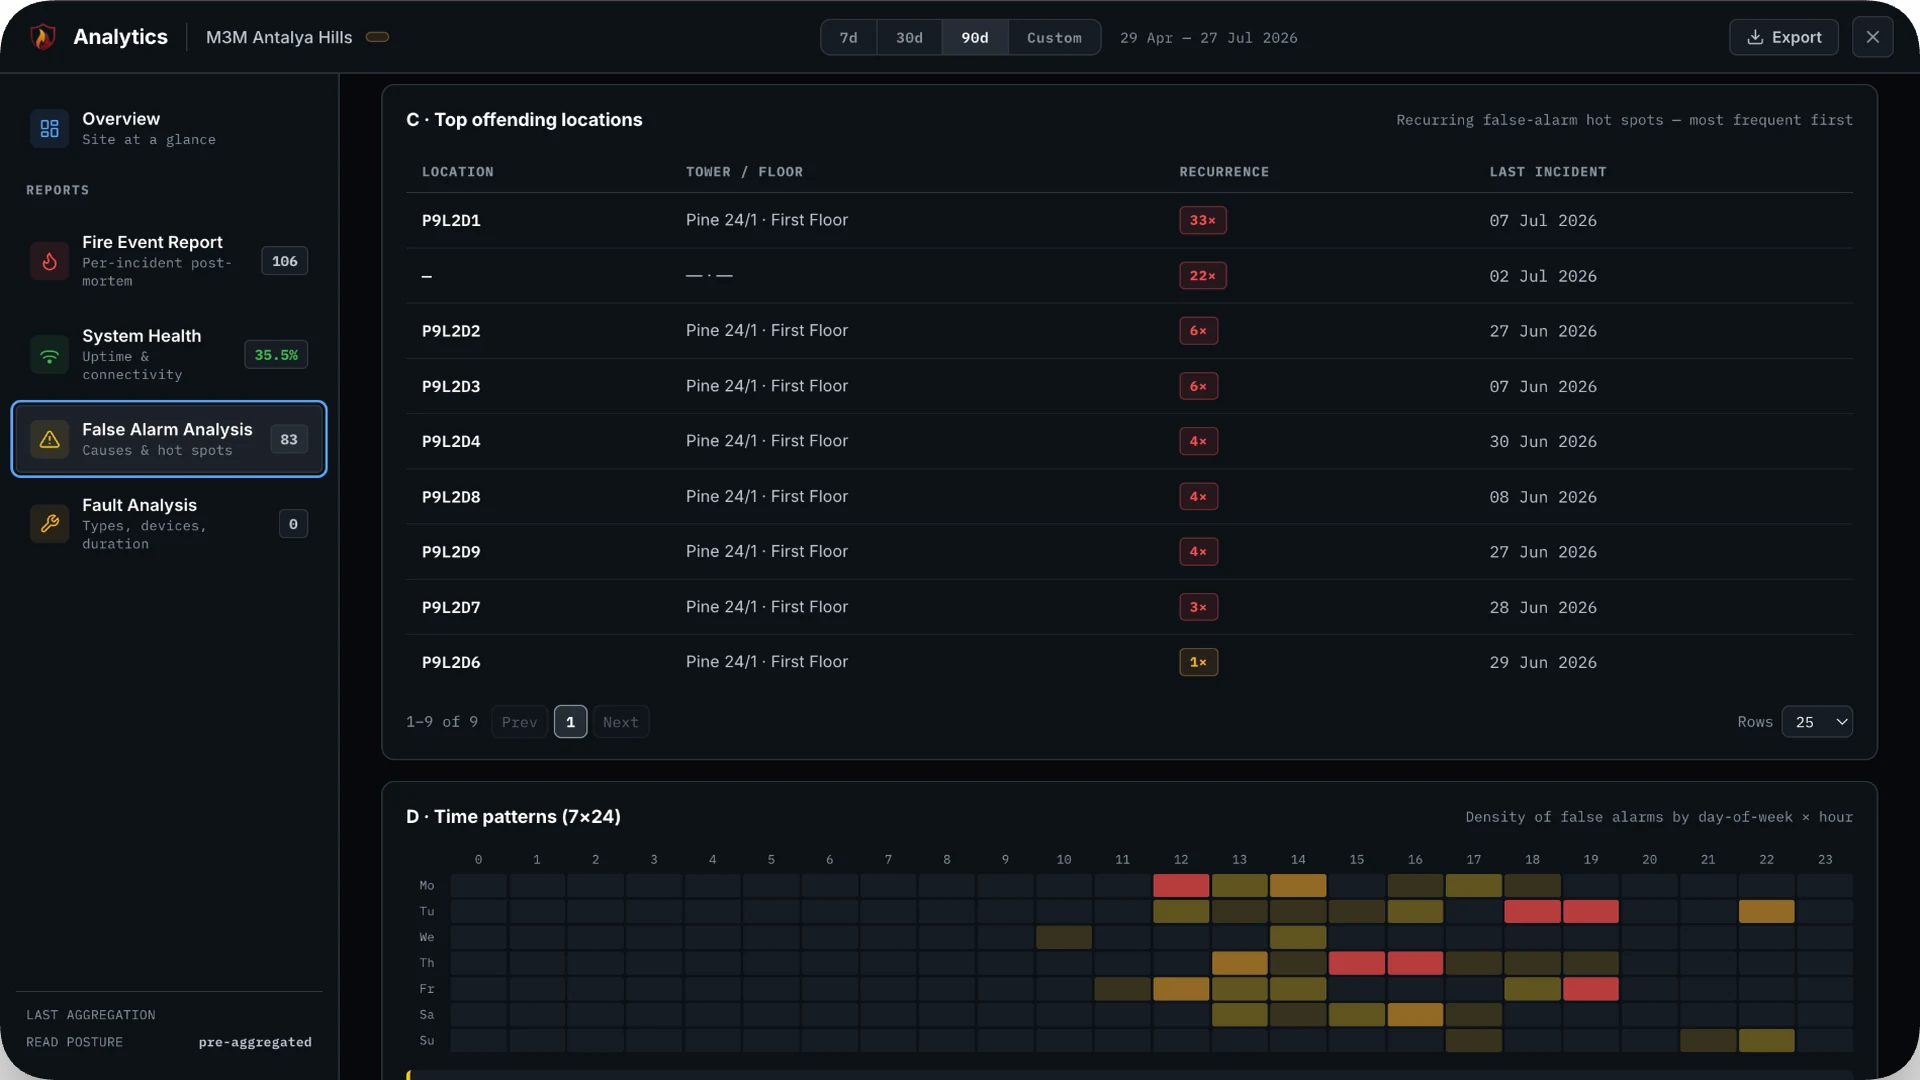
False Alarms
Stop the alarms that cry wolf.
When most alarms are false, people stop running. This report finds why they fire, where they cluster, and when.
- Every false alarm classified by cause as the operator closes it
- Recurring hot spots ranked, most frequent first
- A 7×24 heatmap of exactly when they cluster
- Filter to any panel, loop, or floor and open the incident
Faults
Find what’s failing before it fails you.
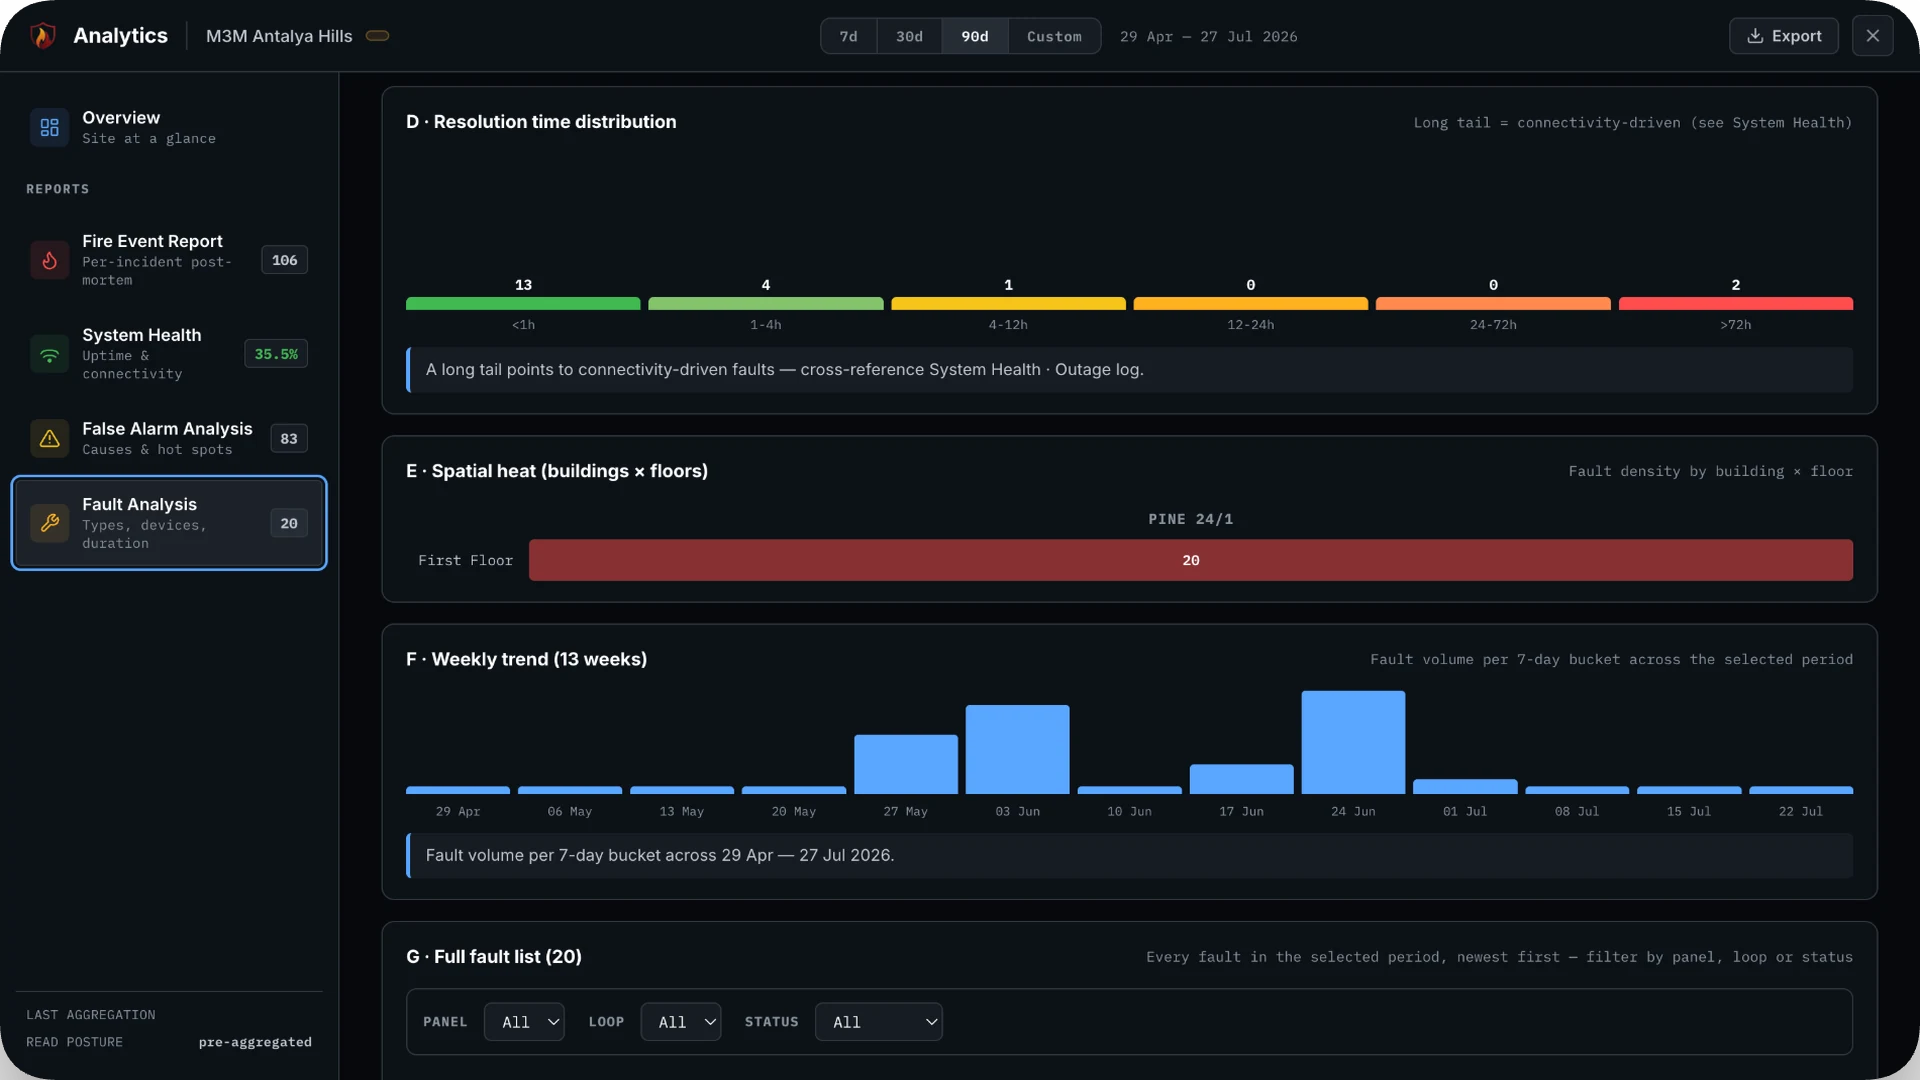
Every fault, where it is, how long it stayed broken — and which devices keep coming back.
- Faults grouped by type, most frequent first
- Repeat-offender devices flagged as replacement candidates
- Resolution times, so a slow AMC has nowhere to hide
- Spatial heat by building and floor
Ready before anyone asks
When the auditor asks, the answer is already downloaded.
Every report exports to a clean PDF, formatted for fire authorities and insurers, with the history behind it — no scramble, no chasing spreadsheets.
It all starts on the live screen.
Analytics opens straight from the Live Monitoring Station — the same events you watch in real time become the record you report on later.
See a real report on your own building.
Book a 20-minute demo. We will walk through a live Fire Event Report, System Health, False Alarms, and Faults on real site data.